Open Nav


Industrial electronic products must operate reliably for years in demanding environments. Unlike consumer electronics with shorter service life expectations, industrial equipment often faces specifications requiring 10 to 20 years of continuous operation. How can manufacturers verify that their PCB designs will meet these long-term reliability requirements without waiting years for real-world data? Accelerated life testing (ALT) provides the answer by subjecting products to stress conditions that accelerate failure mechanisms, enabling reliability predictions from test durations measured in weeks or months rather than years.
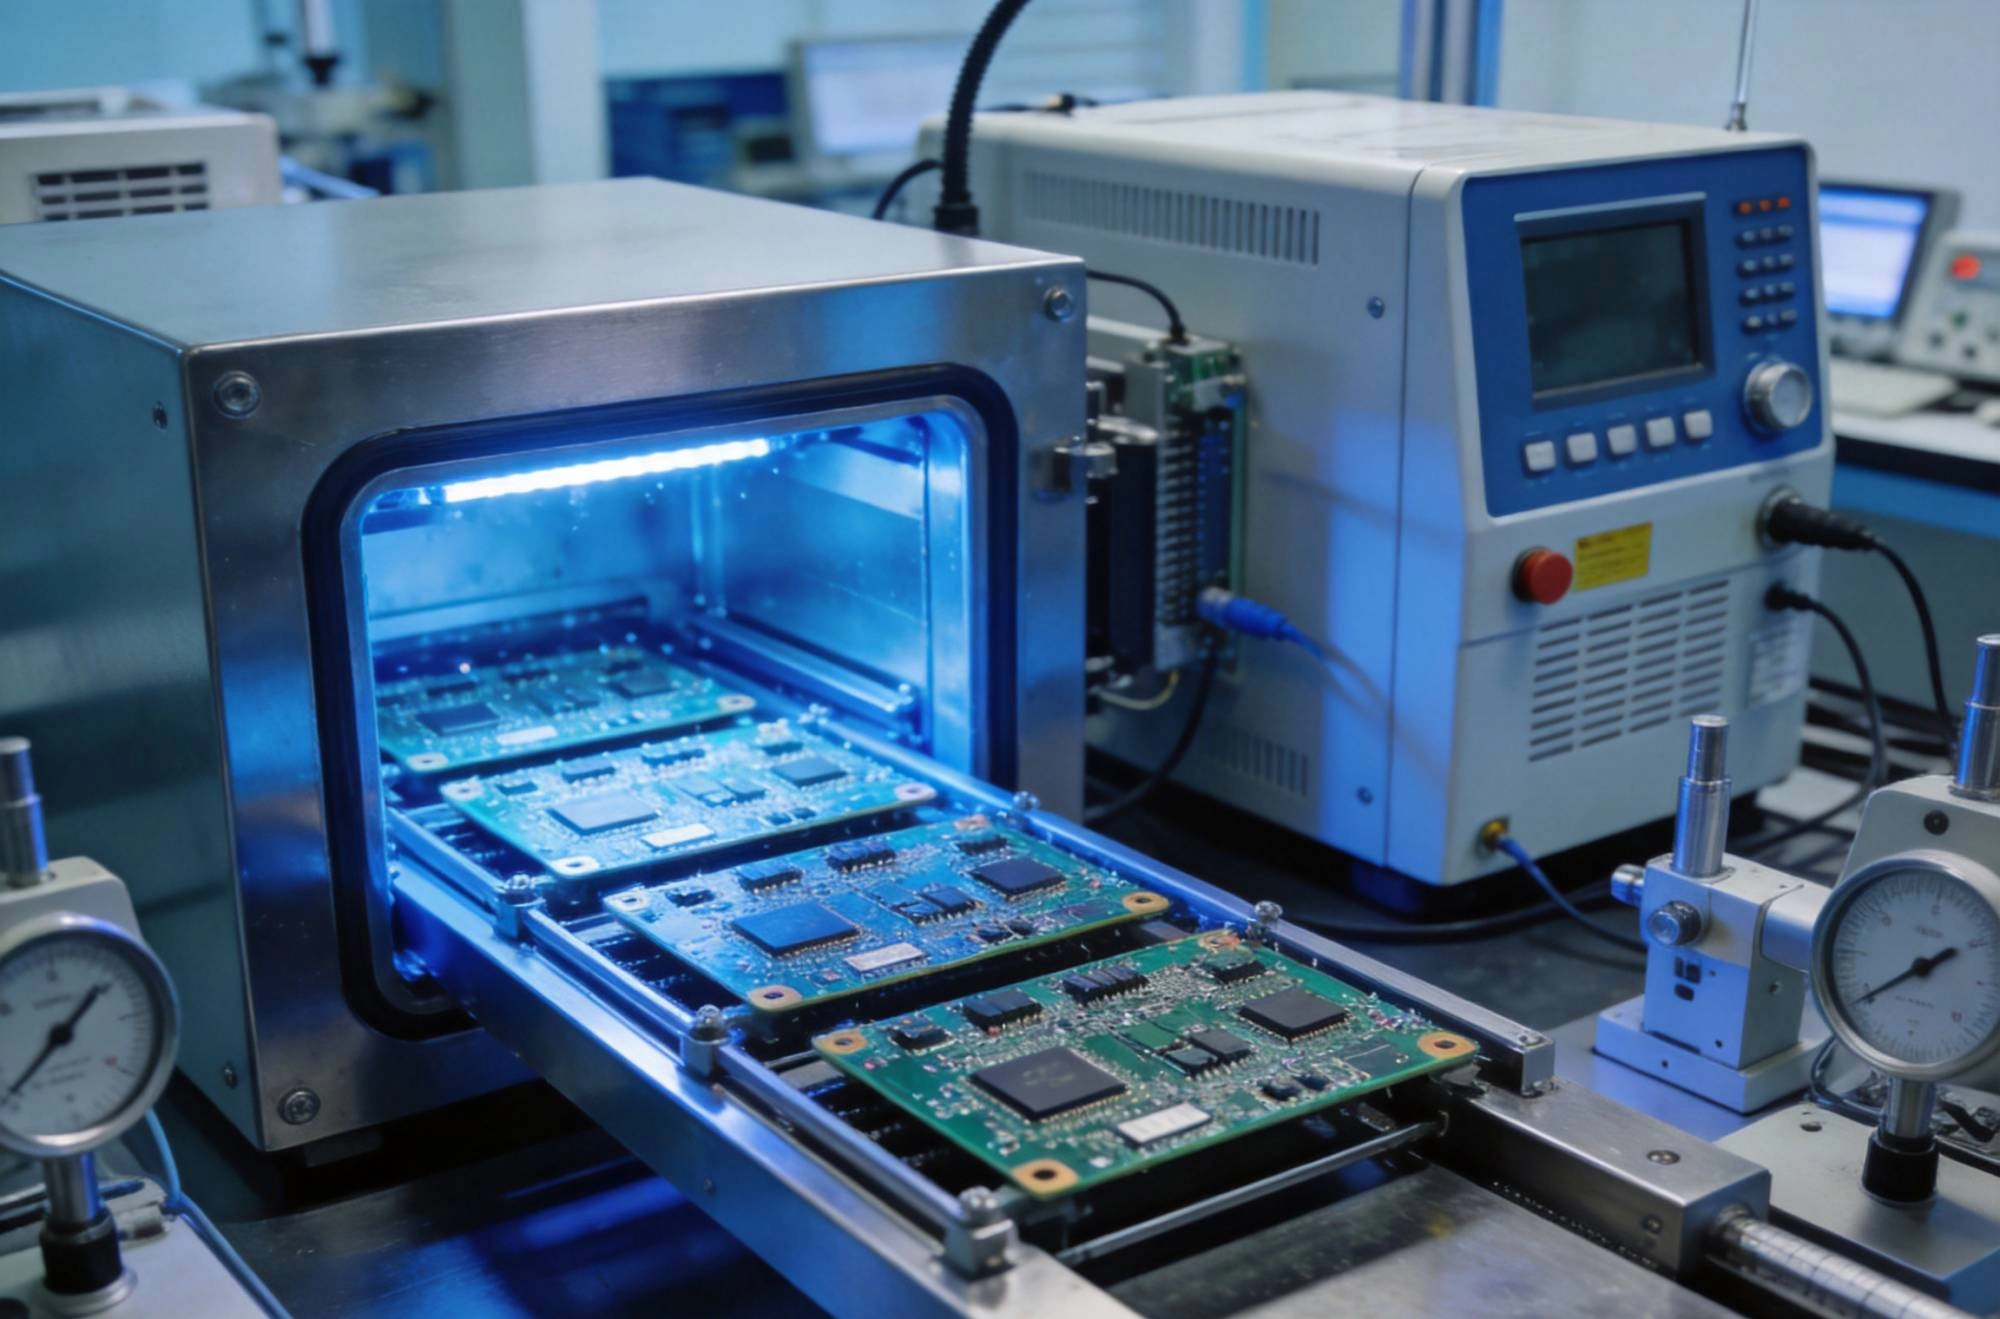
Traditional Reliability Testing that observes products under normal operating conditions requires impractically long durations for industrial applications. When a product specification calls for 20 years of operation, waiting 20 years to verify reliability is impossible in any development cycle. Even 5 to 10 year product development timelines cannot accommodate real-time reliability verification for long-life products. ALT bridges this gap by applying stress levels that accelerate failure mechanisms while maintaining the fundamental failure physics.
The business case for ALT becomes clear when considering the costs of premature field failures. Industrial equipment failures create not only warranty costs but also production downtime that can exceed equipment value in many applications. A $5000 circuit board failure that halts a production line generating $50,000 per day in revenue creates impacts that dwarf the board cost itself. Investing in ALT that prevents such failures delivers substantial return on investment.
ALT relies on the principle that accelerated stress conditions cause the same failure mechanisms that occur under normal use, but at accelerated rates. This acceleration enables reliability extrapolation from test durations to service lifetimes. The key requirement is maintaining the same failure physics—the ways products fail must remain consistent between test conditions and actual use conditions. When different failure mechanisms emerge under accelerated stress, test data loses predictive value.
Acceleration factors quantify how much faster failures occur under test conditions compared to use conditions. A 10x acceleration factor means products fail 10 times faster during testing, allowing one year of service life simulation in approximately 36 days of testing. Understanding acceleration factors enables test designers to select appropriate stress levels that provide meaningful acceleration without introducing unrealistic failure mechanisms.
Temperature cycling represents one of the most important stress types for Pcb Reliability. CTE (coefficient of thermal expansion) mismatch between materials creates mechanical stress during temperature changes. Repeated cycling causes fatigue cracks in solder joints, plated through-holes, and copper traces. This failure mechanism drives many field failures, making temperature cycling essential for reliability verification.
Temperature cycling tests typically specify temperature extremes, dwell times at each extreme, and transition rates. Standard tests like IPC-TM-650 Method 2.6.8 provide industry-accepted profiles, though accelerated tests often use wider temperature ranges than standard profiles to achieve greater acceleration. Typical accelerated cycling might range from minus 40 degrees Celsius to plus 125 degrees Celsius, exceeding typical use conditions while maintaining failure physics consistency.
Constant high-temperature exposure accelerates chemical degradation mechanisms including dielectric material breakdown, solder joint embrittlement, and oxidation of conductive surfaces. High temperature operating life (HTOL) tests apply both elevated temperature and electrical stress, accelerating electromigration mechanisms that cause interconnect failures. Temperature storage tests apply thermal stress without electrical bias, focusing on material degradation mechanisms independent of electrical operation.
Arrhenius equation models the temperature acceleration of chemical degradation, providing mathematical relationships for extrapolating from test temperatures to use temperatures. When test temperature increases from 85 degrees Celsius to 125 degrees Celsius, the acceleration factor typically ranges from 5x to 10x depending on activation energy. This acceleration enables significant reduction in test duration while maintaining predictive validity.
Humidity stress accelerates corrosion mechanisms that cause electrical shorts and opens. Combined temperature-humidity tests apply both stressors simultaneously, accelerating corrosion through increased moisture absorption and reaction rates. Bias humidity testing adds electrical bias to temperature-humidity stress, accelerating Electrochemical Migration that causes dendritic growth and conductive paths.
Standard humidity testing follows profiles like 85 degrees Celsius at 85 percent relative humidity (85/85) for 1000 hours. Accelerated humidity tests might use higher temperature or humidity levels, though excessive acceleration risks condensation that introduces unrealistic failure mechanisms. The key is finding acceleration that speeds corrosion without causing condensation or other unrealistic conditions.
Mechanical vibration accelerates fatigue failures in solder joints, component leads, and board mounting features. Vibration profiles typically match application environments—automotive vibration differs significantly from industrial equipment vibration. Random vibration testing uses frequency spectra that represent actual use environments, while sine sweep testing identifies resonant frequencies that create maximum stress.
Combined environmental testing applies multiple stressors simultaneously, recognizing that field failures often result from interaction between stress types. Temperature-vibration testing simulates operation in vehicles or equipment with both thermal and mechanical stress. Humidity-voltage testing accelerates corrosion under realistic electrical bias conditions. Combined testing provides more realistic acceleration than single-stress testing.
Effective ALT programs focus on the failure mechanisms most likely to limit product reliability. For PCB assemblies, common critical mechanisms include solder joint fatigue from Thermal Cycling, electromigration in high-current conductors, corrosion from moisture exposure, and dielectric breakdown under high temperature stress. Identifying these mechanisms through FMEA (failure modes and effects analysis) guides test design toward the most important reliability risks.
Failure mechanism identification requires understanding both application environments and product design characteristics. Automotive applications prioritize Thermal Cycling and vibration stress. Industrial equipment in humid environments emphasizes corrosion testing. High-power applications require electromigration testing. This analysis ensures test programs address the most significant failure risks rather than providing generic stress exposure.
Stress level selection balances acceleration against realistic failure physics. Too little stress provides insufficient acceleration for practical test duration. Too much stress introduces unrealistic failure mechanisms that compromise predictive value. The optimal stress level provides meaningful acceleration while maintaining consistency with field failure mechanisms.
Step-stress testing helps identify appropriate stress levels by gradually increasing stress until failures occur, then establishing test levels slightly below the threshold where failure physics change. This approach prevents over-stressing that would introduce unrealistic failure modes. Once appropriate stress levels are identified, constant stress testing at those levels provides the acceleration needed for reliability prediction.
Test duration and sample size together determine statistical confidence in reliability predictions. Longer tests with larger samples provide higher confidence but increase cost and schedule. Reliability Testing plans balance these factors to achieve confidence levels appropriate to application requirements. Life-critical applications demand higher confidence and more extensive testing than non-critical applications.
Weibull analysis provides statistical methods for extrapolating test results to population-level reliability predictions. The shape parameter beta indicates failure distribution characteristics, while the scale parameter eta indicates characteristic life. Confidence intervals around these parameters quantify uncertainty in predictions, enabling risk assessment based on test data.
Comprehensive failure data collection enables accurate reliability modeling. Record failure times, failure modes, and failure characteristics for each failed unit. Maintain data on non-failed units that survive the complete test duration, as these censored observations provide important information about reliability. Visual inspection, electrical testing, and failure analysis complete the data picture.
Failure analysis confirms that observed failures match expected mechanisms. When unexpected failure modes emerge, investigate whether test stress introduced unrealistic failure physics or whether the failure mechanism represents previously unrecognized risk. Adjust test programs accordingly to focus on the most significant actual failure risks.
Reliability models transform test data into lifetime predictions. Weibull, lognormal, and exponential distributions provide alternative models for failure time data. Model selection depends on failure physics—mechanical failures often follow Weibull distributions, while chemical degradation may follow lognormal or exponential patterns. Goodness-of-fit tests evaluate how well models match observed data.
Extrapolation from test conditions to use conditions requires acceleration factors for each stress type. Temperature acceleration uses Arrhenius relationships. Mechanical stress acceleration uses power law relationships. When multiple stressors apply, combined acceleration factors account for interaction effects. These extrapolations provide predicted failure rates under actual use conditions.
Reliability predictions always include uncertainty. Practical engineering applies safety margins to predictions, designing for longer life than statistical predictions suggest. Derating components—operating them below their maximum ratings—provides additional margin against unexpected failure mechanisms. This conservative approach accounts for limitations in test coverage and model accuracy.
Safety margins vary by application criticality. Non-critical industrial equipment might use 2x safety factors, while safety-critical applications require 5x or 10x margins. The cost of additional margin balances against the cost of field failures, with more critical applications justifying higher margins.
Multiple standards provide guidance on ALT methodology. IPC-TM-650 describes test methods for environmental testing of PCB assemblies. JEDEC standards cover semiconductor reliability testing, which applies to components used in PCB assemblies. IEC standards provide international guidance on reliability testing practices. Automotive standards like AEC-Q100 specify testing requirements for automotive electronics.
While standards provide valuable guidance, effective ALT programs adapt standard methods to specific product requirements. Standards establish minimum baseline requirements, but the most effective testing goes beyond minimum requirements to address product-specific failure risks.
Effective ALT requires appropriate environmental test chambers, vibration systems, and electrical test equipment. Temperature chambers must achieve the required temperature ranges with rapid transition capabilities for cycling tests. Humidity chambers must maintain precise temperature and humidity control. Combined environmental chambers provide multiple stressor capability.
Electrical monitoring during testing captures failure onset and degradation trends. Continuous monitoring provides more data than periodic inspection, enabling better understanding of failure progression. Automated data logging systems capture temperature, humidity, vibration, and electrical parameters throughout test duration.
How long does accelerated life testing typically take?
Test duration depends on acceleration factors and required confidence levels. Most Industrial Pcb ALT programs range from 1000 to 4000 hours of cumulative testing across multiple stress types. With 10x acceleration, this duration simulates 10 to 40 years of service life. Programs with higher acceleration might require less time, while programs with multiple stress types applied sequentially may require more time.
What is the difference between accelerated life testing and highly accelerated life testing?
Standard ALT uses moderate acceleration that maintains realistic failure physics. Highly accelerated life testing (HALT) uses extreme stress levels specifically to find failure limits rather than predict service life. HALT typically applies increasing stress until failures occur, identifying weak points for design improvement. ALT uses constant stress at predetermined levels for reliability prediction. HALT and ALT serve different complementary purposes.
How many samples do I need for statistically valid results?
Sample size depends on required confidence level, desired statistical power, and expected failure rate. Weibull analysis can provide meaningful results with as few as 5-10 failures, though more samples provide better confidence. Common practice uses 30-50 samples per test condition for industrial applications, with higher samples for safety-critical applications. Statistical power analysis helps determine appropriate sample sizes for specific requirements.
Can ALT predict all types of field failures?
ALT predicts failures caused by stress-related degradation mechanisms. It cannot predict failures caused by random events, Design Errors, or manufacturing defects that escape quality screening. ALT also struggles with failure mechanisms that have very long induction times where acceleration is impractical. For these mechanisms, other verification methods like physical modeling or field data collection supplement ALT data.
How do I validate ALT predictions?
ALT validation occurs through correlation with field data. Collect field failure data as products accumulate service time and compare actual failure rates to ALT predictions. Discrepancies indicate areas where acceleration models or test conditions may need adjustment. Ongoing correlation studies continuously improve ALT accuracy and build confidence in predictions.
Accelerated life testing provides essential capability for verifying Industrial Pcb reliability without waiting years for field data. Well-designed ALT programs subject products to stress conditions that accelerate realistic failure mechanisms, enabling lifetime predictions from practical test durations. The investment in ALT delivers value through reduced field failures, improved customer satisfaction, and lower warranty costs.
Effective ALT requires understanding failure mechanisms, selecting appropriate stress levels, designing statistically valid test plans, and analyzing data with sound reliability models. When these elements come together, ALT provides reliable predictions that support confident product design decisions and risk assessments. The most successful organizations treat ALT not as a one-time test but as an ongoing capability that improves with each product generation.
Start by identifying the most critical failure mechanisms for your specific applications. Implement ALT programs that target these mechanisms with appropriate stress profiles. Use test results not just for prediction but for design improvement, using failure analysis insights to strengthen weak points. Over time, build institutional knowledge about acceleration factors and failure physics that enhances ALT effectiveness across your product portfolio.

Overcoming Common Defects in Industrial PCB FabricationAugust/03/2026
Advanced Techniques in Multi-Layer Industrial PCB FabricationJune/03/2026
Precision Engineering: Tolerances in High-End Industrial PCB FabricationSeptember/03/2026
The Impact of Surface Finishes on Industrial PCB Fabrication QualityJuly/16/2026
Materials, Methods, and Industry Standards ExplainedMay/27/2026

How to Choose the Right Manufacturer for Industrial PCB FabricationJune/29/2026
How to Ensure Quality Control in High-Mix Low-Volume Industrial PCBAJuly/21/2026
Thermal Management Strategies for Long-Term Industrial PCB ReliabilityJune/04/2026