Open Nav


Every PCB production line has hidden inefficiencies draining profit. Maybe it's the hours lost sorting component reels before assembly. Perhaps it's the late-night scramble when a last-minute ECO arrives. Or the rework station that never seems to empty.
Industrial Pcb production is complex. Variables interact in ways that make optimization challenging—yet those who master these interactions gain sustainable competitive advantages. After working with dozens of electronics manufacturers, certain optimization patterns emerge repeatedly. Five critical steps consistently separate highly efficient production lines from those constantly fighting fires.
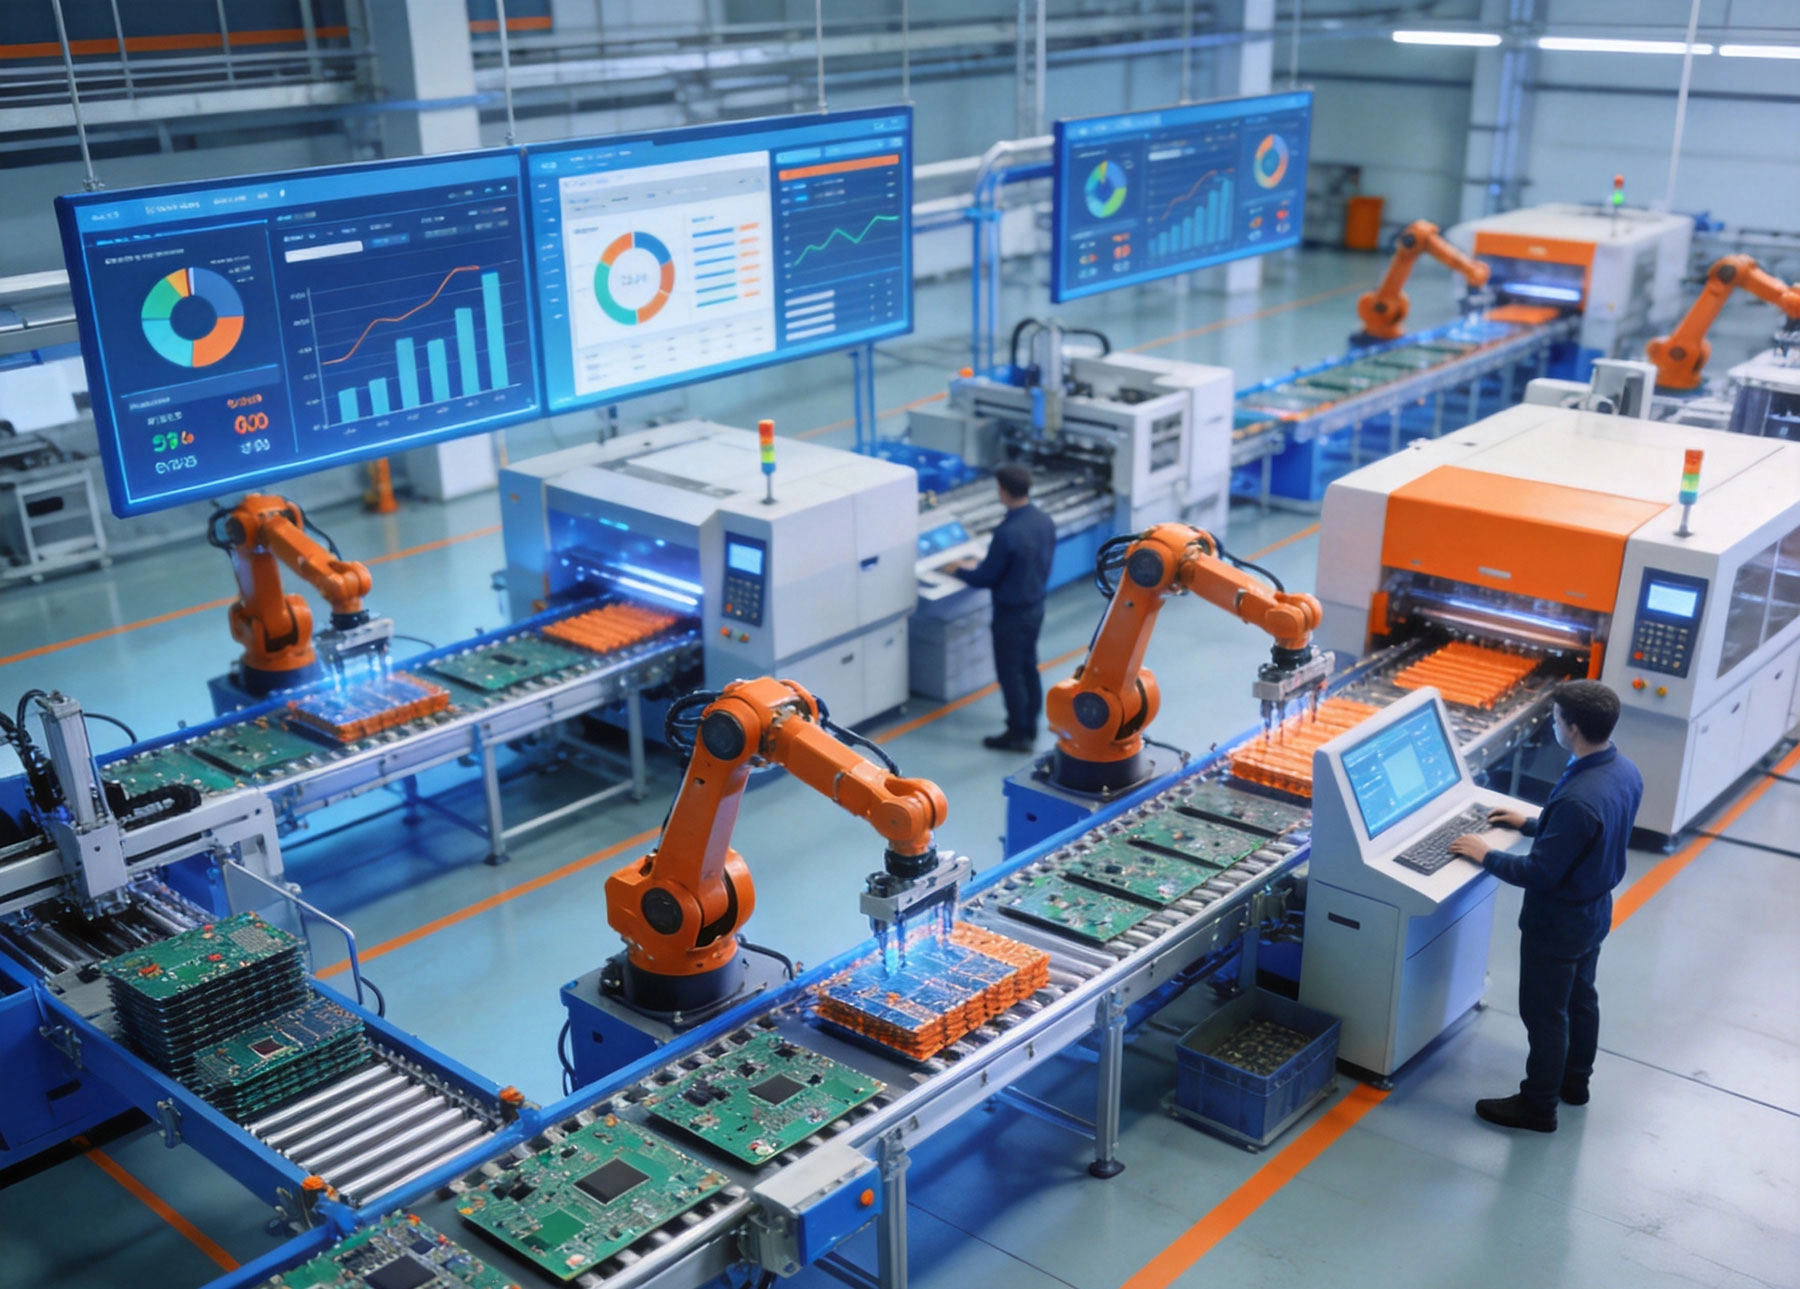
Most PCB production schedules fail at the planning stage. They assume perfect material availability, ignore changeover times, and treat machine uptime as guaranteed. Real-world production requires planning that accounts for reality.
Effective production planning connects directly to actual demand signals. When your best customers share their forecasts—even rough ones—you can stage materials before orders firm up. This isn't about blindly building inventory; it's about having components ready when firm orders arrive.
Many manufacturers connect customer forecasting portals to their ERP systems, enabling automatic purchase order generation when forecasts exceed threshold quantities. The goal: material arrives within days of order confirmation, not weeks.
Infinite capacity scheduling—where you schedule as if unlimited resources exist—is the root cause of most production chaos. Finite capacity scheduling acknowledges real machine availability, changeover times, and batch size constraints. Tools implementing finite capacity algorithms provide realistic delivery dates and expose bottlenecks before they become crises.
Even spreadsheet-based finite capacity analysis improves scheduling accuracy dramatically compared to seat-of-the-pants planning. The key is honestly accounting for changeover times—typically 15 minutes to 2 hours depending on complexity—that most schedulers underestimate.
Production schedules must evolve when conditions change. An equipment failure, material shortage, or urgent customer request requires intelligent re-scheduling, not panic. Systems that automatically highlight affected orders and suggest recovery actions reduce crisis management to routine adjustments.
A production floor that responds calmly to disruptions—rather than scrambling—produces more consistently and with lower stress levels.
Material waste in PCB production takes many forms: excess inventory consuming capital, stockouts stopping lines, unnecessary movement wasting time, and waiting starving downstream processes. Material flow optimization touches all these.
Most assembly lines stage components based on historical patterns or technician preference. This creates two problems: rarely-used components occupy prime staging space while frequently-used components are repositioned constantly.
Analysis of actual component consumption—tracked at the feeder level, not just the job level—reveals optimal staging configurations. The goal: most-used components nearest the placement head's home position, with clear paths for material replenishment.
Some manufacturers use bar code tracking to automatically record which components are consumed, enabling continuous staging optimization without manual analysis.
Moving material preparation off the critical production path improves throughput and reduces changeover disruptions. Kitting—preparing all components for a specific build—transforms changeovers from frantic material hunts into organized kit exchanges.
The kitting investment pays through faster changeovers, reduced errors, and easier work-in-progress tracking. For high-mix production environments, kitting is essential rather than optional.
Certain components—connectors, capacitors, resistors—appear in nearly every build. These high-velocity items benefit from Kanban replenishment systems that automatically trigger reorders when stock drops below thresholds.
Electronic Kanban systems integrated with ERP platforms eliminate manual reorder decisions, ensuring consistent stock levels without dedicated procurement attention.
Changeovers—switching from one product to another on production equipment—represent massive hidden productivity losses. A line that changes over three times per shift may lose 20% or more of available production time to changeovers.
Single Minute Exchange of Die (SMED) provides structured methodology for changeover reduction. Originally developed for stamping operations, SMED principles apply directly to Pcb Assembly:
SMED analysis typically reveals 50% or greater changeover time reductions achievable through relatively simple changes.
Not all changeovers are equal. Some product combinations share components, fixturing, or programs. Sequencing jobs to maximize similarities reduces effective changeover time dramatically.
Scheduling algorithms that group similar products together—minimizing tooling changes, program loads, and material swaps—return substantial productivity gains for high-mix operations.
Physical tooling design affects changeover speed significantly. Tooling that requires tools for installation, or fixtures with time-consuming adjustment procedures, slow every changeover.
Quick-release mechanisms, tool-less clamping, and pre-adjusted spare fixtures enable changeovers measured in minutes rather than hours. The tooling investment pays back through improved equipment utilization.
Effective Quality Control in PCB production requires knowing what to measure, how to measure it, and what to do with the results. Data-driven approaches separate continuous improvement from reactive problem-solving.
Every PCB process has parameters that most affect quality. Paste temperature affects viscosity. Reflow peak temperature affects solder joint formation. Placement accuracy affects alignment. Identifying these critical parameters—and monitoring them continuously—prevents defects rather than detecting them after completion.
Process Failure Mode and Effects Analysis (PFMEA) provides structured methodology for identifying critical parameters. The effort invested in PFMEA documentation pays through focused monitoring and reduced defect rates.
Tracking individual measurements reveals trends that point counts miss. SPC charts showing control limits and trend indicators alert operators to process drift before specifications are violated.
Modern SPI and Aoi systems capture data automatically, enabling SPC analysis without manual data entry. The insight available from this data—patterns, correlations, capability indices—transforms quality from inspection-driven to prevention-driven.
Data without action is worthless.闭环反馈 systems connect quality measurements directly to process adjustments. When solder paste inspection reveals consistent print volume deviations, the system should automatically trigger printer parameter review.
This closed-loop approach requires integration between inspection systems, process equipment, and workflow management platforms. The investment in integration pays through faster response to quality issues and reduced manual monitoring burden.
Technical improvements without cultural support fade quickly. Sustainable optimization requires engaging everyone on the production floor in continuous improvement efforts.
Operators closest to production processes often see problems first—and solutions that engineers miss. Empowerment means giving operators authority to stop production for quality issues, suggest process improvements, and participate in problem-solving teams.
This requires trust that operators will use this authority responsibly. Building that trust—through training, clear escalation procedures, and management support for operator decisions—takes time but pays dividends through engaged workforce and faster problem resolution.
Kaizen events—focused improvement sprints targeting specific problems—accelerate improvements that might otherwise wait months for attention. Effective Kaizen events have clear scope, committed participant time, and management support for implementing results.
Typical Kaizen event structure:
Events producing immediate, measurable improvements build momentum for subsequent efforts.
Visual management makes production status obvious at a glance—eliminating the need for status meetings and reports. Andon displays showing line status, Kanban cards showing inventory levels, and color-coded floor markings showing flow paths enable immediate situational awareness.
Effective visual management requires discipline in maintaining accuracy. When visual indicators become stale, they lose value and trust. Regular audits ensure visual systems reflect reality.
Optimization efforts require measurement to validate improvements and guide continued focus.
Effective KPIs for PCB production optimization include:
Track these metrics over time and by product line. Improving trends indicate successful optimization; declining trends signal emerging problems.
Comparing your metrics against industry benchmarks provides context for improvement efforts. Industry associations, equipment suppliers, and consulting firms often publish benchmark data for Electronics Assembly operations.
World-class Pcb Assembly operations achieve OEE above 85%, FPY above 98%, and schedule attainment above 95%. Reaching these levels requires sustained attention to all five optimization steps.
Optimization efforts sometimes backfire when approached incorrectly.
Automating chaotic processes locks in inefficiency. Attempting automated material handling on a floor with poor layout, or automated inspection on a line with unstable processes, wastes technology investment. Fix process fundamentals before automating.
Technology solutions require trained people to implement and maintain. Installing sophisticated software without adequate training produces frustration and abandonment. Budget training time and ongoing support for new systems.
Optimization is continuous, not terminal. Waiting for perfect conditions delays improvements that would help today. Implement partial solutions that deliver immediate benefits while planning comprehensive approaches.
Modern technology supports optimization efforts across all five critical steps.
MES platforms integrate production data from disparate sources—equipment PLCs, Aoi systems, ERP platforms—into unified operational visibility. Real-time tracking of work orders, equipment status, and quality metrics enables responsive management and data-driven improvement.
Cloud-based MES platforms reduce implementation complexity and cost compared to traditional on-premise deployments, making advanced production management accessible to smaller operations.
Equipment failures disrupt production schedules and inflate maintenance costs. Predictive maintenance technologies—vibration analysis, thermal imaging, process parameter trending—identify equipment issues before they cause failures.
These technologies convert reactive maintenance (fixing failures) to proactive maintenance (preventing failures), improving equipment availability and reducing emergency repair costs.
Digital twin technology creates virtual models of production systems, enabling simulation of changes before implementation. Test scheduling algorithms, evaluate layout modifications, or optimize material flow without disrupting actual production.
As digital twin costs decline, this technology becomes accessible to broader production operations, enabling optimization experiments that would be impractical with physical systems.
Optimizing Industrial Pcb production requires attention across multiple dimensions simultaneously. The five critical steps—production planning, material flow, changeover management, Quality Control, and continuous improvement—interact and reinforce each other.
No single step delivers maximum benefit alone. Production plans fail without reliable material flow. Fast changeovers mean nothing with poor quality. Continuous improvement culture amplifies technical solutions across the organization.
The path forward starts with honest assessment: where does your operation stand on each of the five steps? Which gaps cause the most pain? What would improvement in each area be worth to your business?
Begin with the highest-impact opportunity. Implement, measure, learn. Then address the next priority. Organizations that sustain this discipline—rather than seeking silver bullets—build the competitive advantages that compound over time.
Initial improvements appear within weeks—particularly for changeover and material flow optimizations requiring primarily procedural changes. Achieving full optimization typically requires 12 to 18 months of sustained effort. Culture changes take longest; expect 2 to 3 years for deep-rooted improvements in continuous improvement practices.
Well-executed optimization programs typically deliver 150% to 300% ROI within the first year. The range reflects variation in starting conditions, implementation quality, and measurement methodology. Most companies see payback within 6 months for focused initiatives like SMED or kitting programs.
For initial optimization efforts, experienced consultants accelerate progress and reduce learning-curve costs. However, sustainable improvement requires building internal capability—the organization's own people must own and drive ongoing optimization. Balance consultant engagement with knowledge transfer to ensure lasting impact.
Prioritize based on impact and feasibility. High-impact, high-feasibility initiatives deliver quick wins that build momentum. High-impact, low-feasibility challenges require capability building or resource acquisition. Low-impact initiatives—regardless of feasibility—deserve low priority.
Resistance to change typically proves larger than technical barriers. Operators, supervisors, and managers comfortable with current processes often resist modifications—even improvements. Overcoming this resistance requires clear communication of why changes are necessary, involvement of affected people in planning, and visible management commitment.
Sustainable gains require standardizing improved processes, training all personnel consistently, and monitoring performance metrics continuously. Without standardization, improvements revert when key individuals leave or attention shifts elsewhere. Build review cycles into regular operations to catch regression early.
This article is intended for informational purposes. Consult with qualified manufacturing engineering professionals and operations consultants for specific optimization recommendations for your situation.
Cost Reduction Strategies in High-Volume Industrial PCB ProductionSeptember/18/2026
The Complete Guide to Manufacturing Processes and Industry ChallengesMay/27/2026
Understanding the Lifecycle of an Industrial PCB Production RunJuly/31/2026
Key Differences Between Consumer and Industrial PCB ProductionJune/27/2026
Navigating Supply Chain Challenges in Global Industrial PCB ProductionOctober/14/2026
How to Scale Your Industrial PCB Production for Mass ManufacturingJune/02/2026

How Automation is Revolutionizing Industrial PCB Production in 2026September/02/2026
Ensuring Industrial PCB Reliability in Extreme Environmental ConditionsMay/27/2026